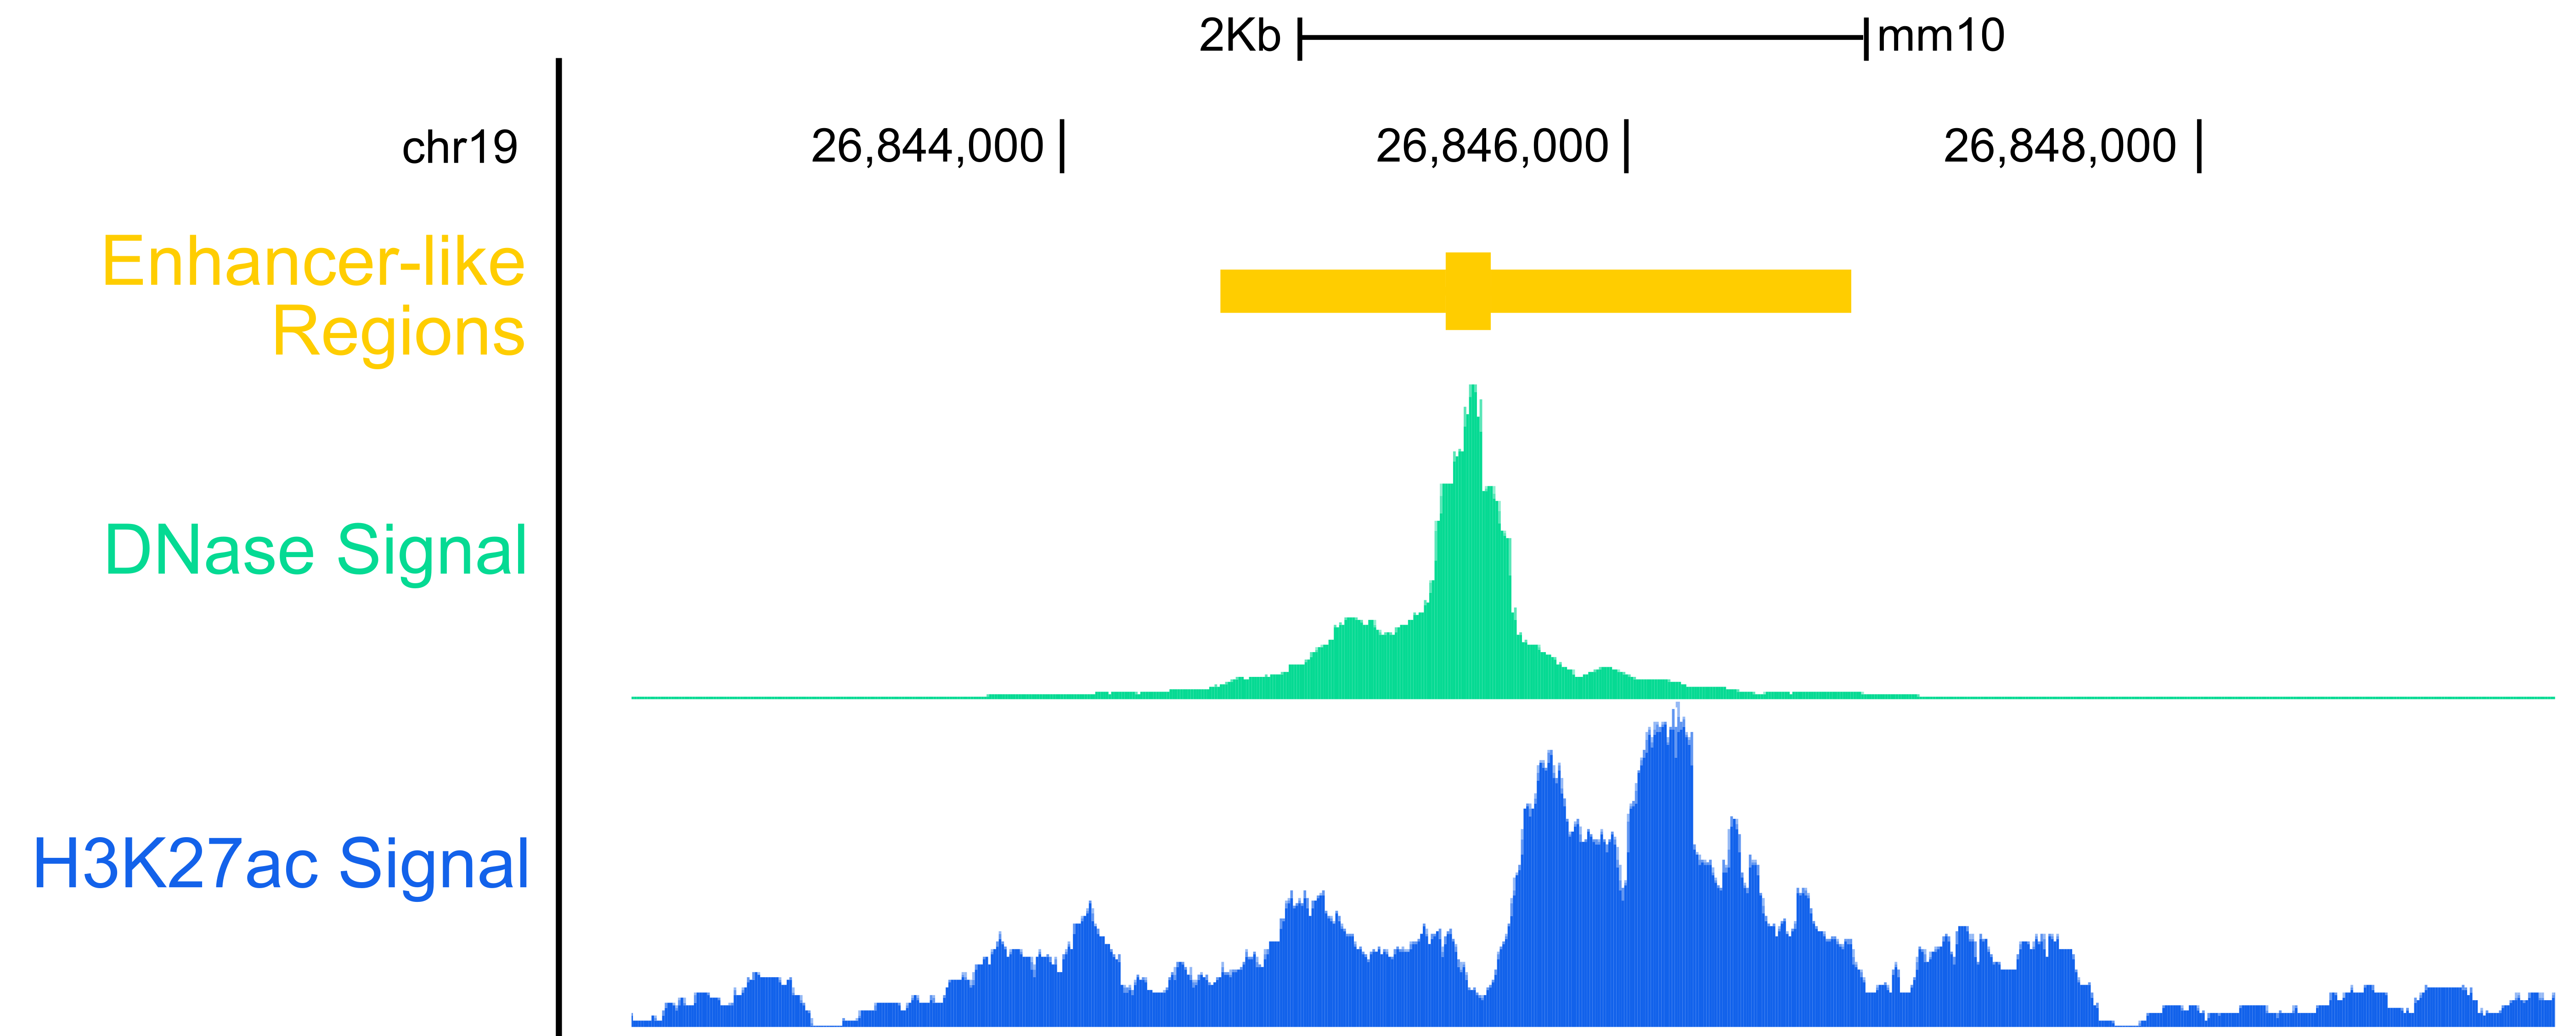
 Tracks can be of different types. On the picture is shown two signal tracks (in blue, green) displaying quantitative signal and a feature track (in yellow) displaying coordinate base information.
The Furlong lab proposes a tool to conveniently browse the lab genomic data
Visualisation of genomic data is fundamental for gaining insights into genome function. Yet, co-visualisation of a large number of data sets remains a challenge in all popular genome browsers and the development of new visualisation methods is needed to improve the usability and user experience of genome browsers.
The Furlong Lab presents Dynamix, a JBrowse plugin that enables the parallel inspection of hundreds of genomic data sets. Dynamix takes advantage of a priori knowledge to automatically display data tracks with signal within a genomic region of interest. As the user navigates through the genome, Dynamix automatically updates data tracks and limits all manual operations otherwise needed to ad-just the data visible on screen. Dynamix also introduces a new carousel view that optimises screen utilisation by enabling users to independently scroll through groups of tracks.
Quick Links
Get code and support
- Dynamix GitLab repository hosted by the EMBL GitLab server
- Dynamix Google Support group — or via email at dynamix-support
Hands on Dynamix
- The DynamixDemo instance released with Monfort et al. 2017, Bioinformatics to test Dynamix’s main features.
- The 4CBrowser instance to browse the 4C-seq data from Ghavi-Helm et al. 2014, Nature – dm3
- The FurlongBrowser to browse the Furlong lab published data (with complementary published datasets from other labs) – dm3
Key features
-
Automated track display
A key concept behind Dynamix is to anticipate users’ actions and execute them automatically. Practically, for a given genomic window Dynamix removes tracks without features or containing only background level signal (i.e. locus-specific empty tracks) from the track container and replaces them with tracks containing features or signal above background (i.e. locus-specific interesting tracks). As the user interacts with the browser (panning of the viewport, change of location by gene name query, or zooming in and out), Dynamix assembles the list of locus-specific interesting tracks and updates JBrowse’s track container, i.e. missing interesting tracks are added following a pre-defined order while locus-specific empty tracks are removed.
-
Track grouping
Dynamix brings a grouping feature to JBrowse allowing managed tracks to be organised into different track groups. Each Dynamix track group has its own configuration. When multiple groups are defined, Dynamix displays information through its UI widgets. The master widget shows a summary of the individual group information. Individual track group statistics and settings (browsing mode and relevant controls specific to the manual mode) are readily accessed by clicking on the master widget.
-
Display customisation
Controlling where tracks are automatically added into the track container is extremely important to achieve a consistent and reproducible user experience.
- Dynamix always renders the tracks of a track group in a continuous block
- The display order of tracks within a group is pre-defined and fully customisable
- Track group anchoring within the track container can be configured such that a track group is always displayed right below a particular static track or track group
-
Carousel browsing
At particular genomic locations, the number of interesting tracks can be large and exceed the user’s hardware capabilities, possibly resulting in a browser crash. To address this issue, the maximum number of tracks to display for each track group can be configured (to fine-tune user’s screen usage). When the number of interesting tracks exceeds the configured maxima, only a fraction of the interesting tracks is rendered and a visual cue warns the user that data is missing from the display. Dynamix introduces the concept of carousel browsing which allows to view the hidden interesting tracks of a group. Upon each click on the carousel control, half of the visible interesting tracks are replaced with hidden tracks following the predefined track order.
Dynamix in action
Make sure to read next section to better get to know the Dynamix interface and key concepts
You can get your hands on Dynamix on two of the live instances of JBrowse that have been setup by the lab:
- The FurlongBrowser gathers all of our published data (as well as complementary published datasets from other labs) — dm3
- The 4CBrowser provides an access for browsing the data that has been generated by Ghavi-Helm et al. 2014, Nature — dm3
- The DynamixDemo where Dynamix’s main features can be tested. This instance was released with Monfort et al. 2017, in Bioinformatics
Dynamix User Interface
Enabling the plugin
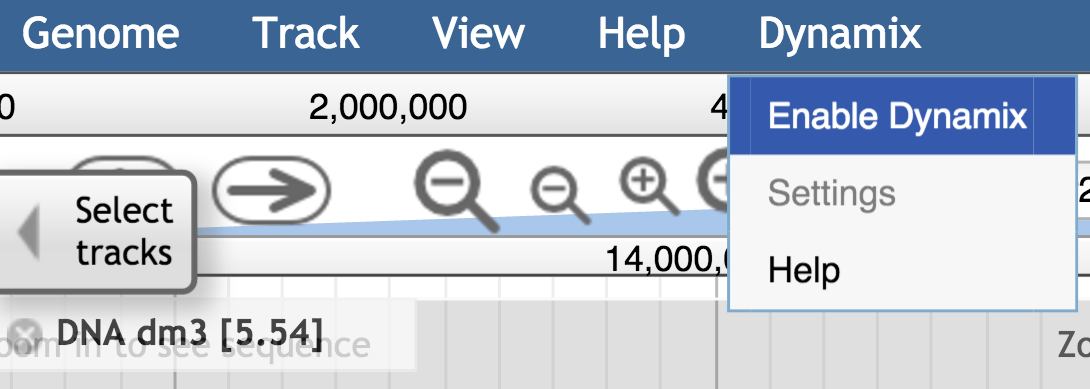
Dynamix is made to enhance the browsing experience. It can be enabled (or fully disabled) from the JBrowse main menu. Through this menu, the user can also access the dynamix group settings. The setting window allows user to modify settings for the session, but will not modify the configuration file itself. For permanent changes, the dynamix configuration file (dynamix_conf.json) in the instance data/dynamix/ folder needs to be modified.
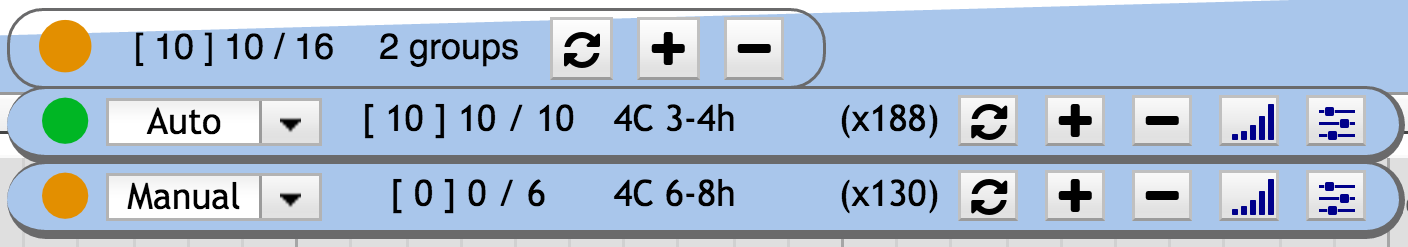
Once enabled, a widget is added to the view, in the right part of the navigation bar. This widget contains the textual and visual sum up of the information occurring in the view, as well as buttons for the user to interact with – see next section.
Dynamix Interface Widgets
- Main widget
The main widget provides a general visual sum-up of the information available at the current genomic position taking into consideration all the registered tracks for all the different groups. It also provides interactive elements to update the view, which sequentially triggers update of each individual group. A click on the main widget will open a drop-down that contains group widget(s)
- Group widgets
Dynamix can handle several groups, each with its own behaviour. Each group possesses its own widget that contains similar information and buttons than the main widget. The differences are: the Select menu, that allow to change the group behaviour from *automatic* to *manual* (or disabled), and the toggle signal/features buttons.
When using the *manual* mode, the user has to interact with the dynamix interface to get the track container updated. When using the main widget buttons, the track container is updated for all groups. The user can interact with:
- The group behavior selector (auto – manual – disabled)
- The plus button inserts missing relevant tracks on the observed genomic location,
- The refresh button hides irrelevant tracks *and* inserts missing relevant tracks on the observed region. In case max tracks is reached and a part of the relevant tracks is not shown, it allows a turnover of visible relevant tracks. Hiding visible relevant tracks and showing not shown relevant tracks
- The minus button hides tracks
- The signal toggle button allows to toggle the display of signal tracks.
- The features toggle button This button allows to toggle the display of feature tracks.
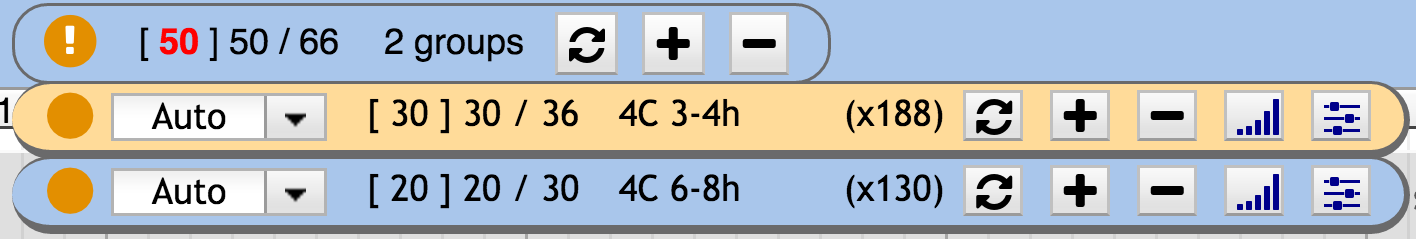
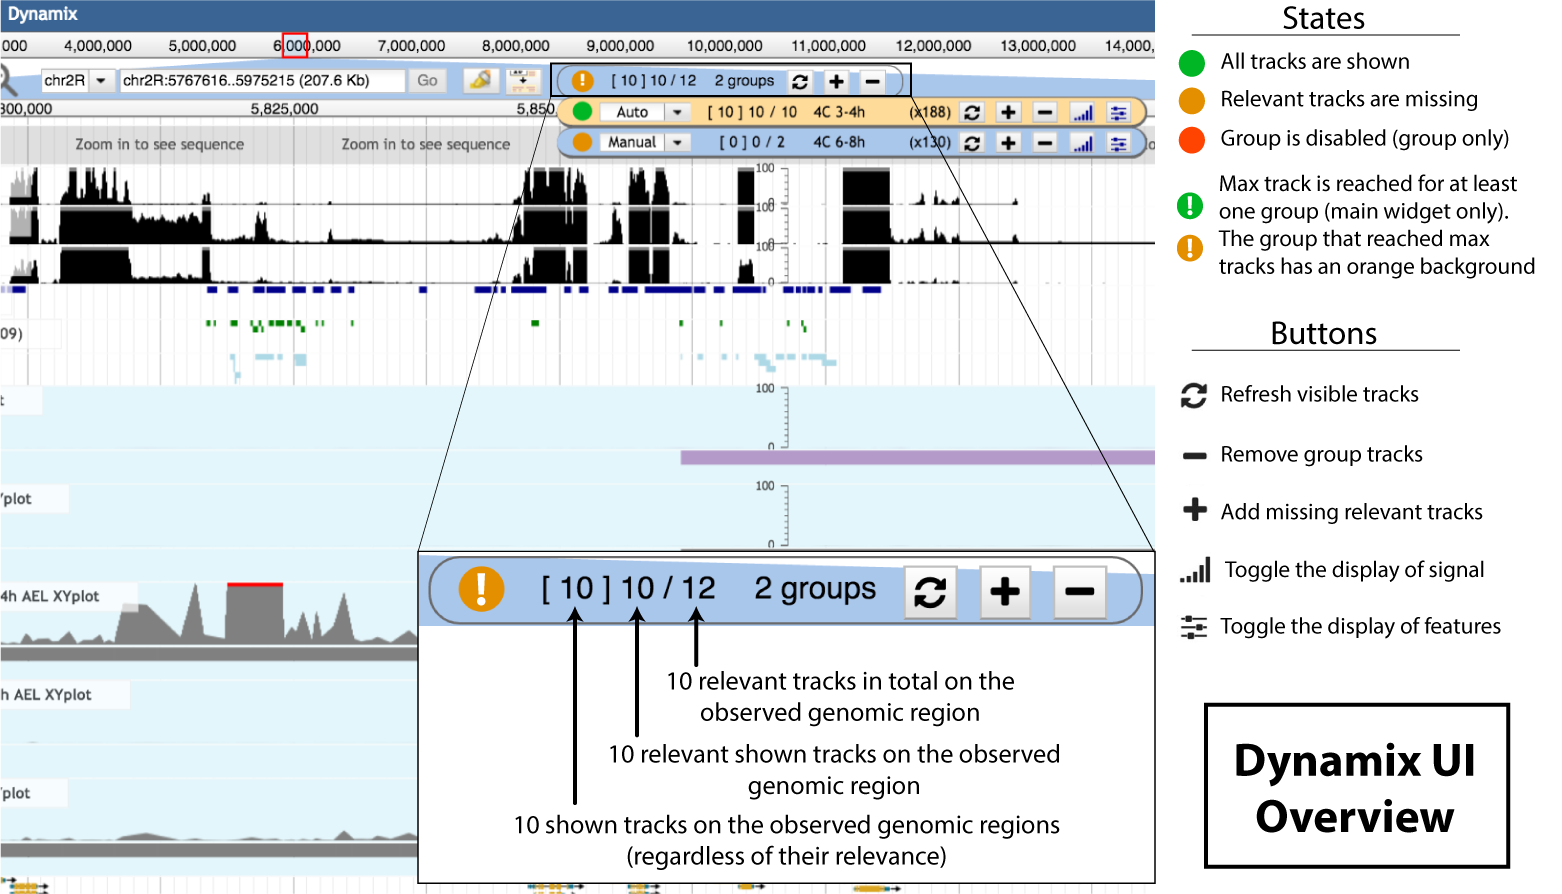
When relevant tracks are missing, the circle indicator is orange , while green when everything relevant is shown. When max track is reached for at least one group an exclamation mark appears in the state circle. The associated group widget background turns orange. When the global max track is reach the number of shown tracks turns red ( [ X ] Y / Z ).
Detailed Dynamix Widget interface
The Dynamix widget displays visual and textual information about the currently shown genomic information over the observed region. The widget also have buttons for the user to interact with. Clicking on the main widget opens a drop-down menu that displays individual groups information. The main widget is just a summary of individual groups information.
1. State icon
The state icon follows a three-state color code ( , , ). The color gives visual details about the current display status of the group. The state refers to the completeness of the information that is displayed.
- indicates that the user currently sees all the relevant information, i.e. all the tracks that should be displayed at this position are indeed displayed,
- is displayed when the user is missing relevant information,
- when the group is disabled.
The main widget equivalent has only two states. if all relevant tracks from all groups are displayed, otherwise.
2. Group mode selector
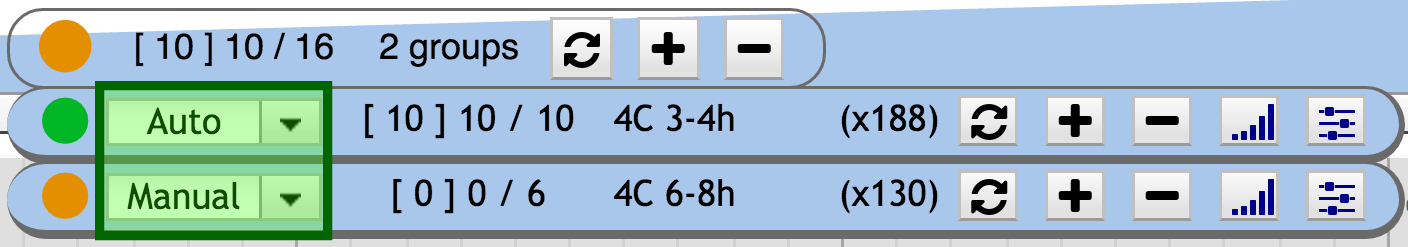
Three behaviours are available for a group: automatic | manual | disabled.
A select button is available to switch between the different behaviours.
Automatic mode:
The set of observed tracks is automatically modified. Obsolete tracks on the observed genomic regions are hidden while relevant tracks are shown as the user browses. Hence, the user always focuses on the information of interest. This behaviour might not be needed in all situations. To address other use cases, a complementary manual mode is available.
Manual mode :
The widget information is always updated, telling the user about what he is viewing/missing. However, the tracks themselves are not automatically shown nor hidden without explicit user interaction with the update buttons.
Disabled mode:
Disabling a group of tracks is used when the user wants to handle this group in the classic way, like if it was not defined in the plugin configuration file. The difference between manual and disabled modes is that in disabled mode, the tracks of the disabled group are not considered when computing the overall state i.e. green vs. orange icon state.
3. Information sum-up:
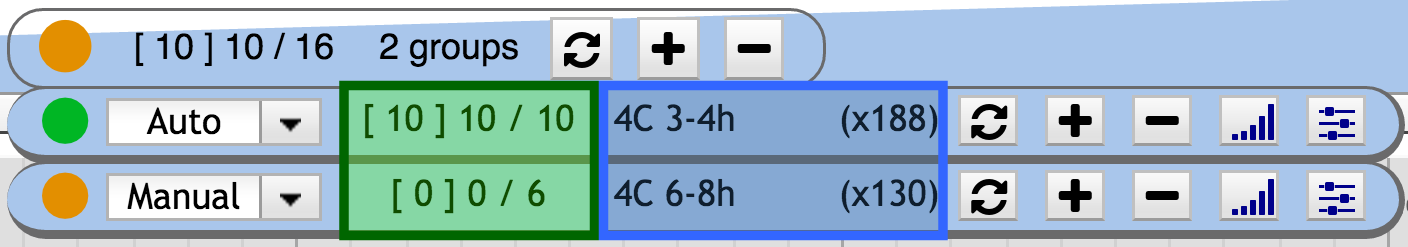
The main and group widgets provide a general sum-up of the information available at the current genomic position. The text sum-up follow this pattern [ X ] Y / Z:
- X is the total number of tracks that are currently displayed by the group on the observed region, disregarding their relevance.
- Y is the number of shown relevant tracks
- Z is the total number of relevant track on the observed region
4. Update buttons

When using the *manual* mode, the user has to interact explicitely with the dynamix interface to get the track container updated. When using the main widget buttons, the track container is updated for all groups. The user can interact with:
- The group behavior selector (auto – manual – disabled)
- The plus button inserts missing relevant tracks on the observed genomic location,
- The refresh button hides irrelevant tracks *and* inserts missing relevant tracks on the observed region. In case max tracks is reached and a part of the relevant tracks is not shown, it allows a turnover of visible relevant tracks. Hiding visible relevant tracks and showing not shown relevant tracks
- The minus button hides tracks
- The signal toggle button allows to toggle the display of signal tracks.
- The features toggle button This button allows to toggle the display of feature tracks.
5. Warning states
Depending on the type of data or the computing resources available, one might need to limit the number of track that Dynamix automatically adds within the track container. There are two independant ways of doing so, each defined by its own configuration parameter.
The user can limit the number of tracks that each group individually adds to the track container. To control this, each group has a “max_tracks” parameter which defines the maximum number of track that the group can add on a given genomic interval. When this number is reached, the group widget background is changed to orange and the main widget state icon displays an exclamation mark.
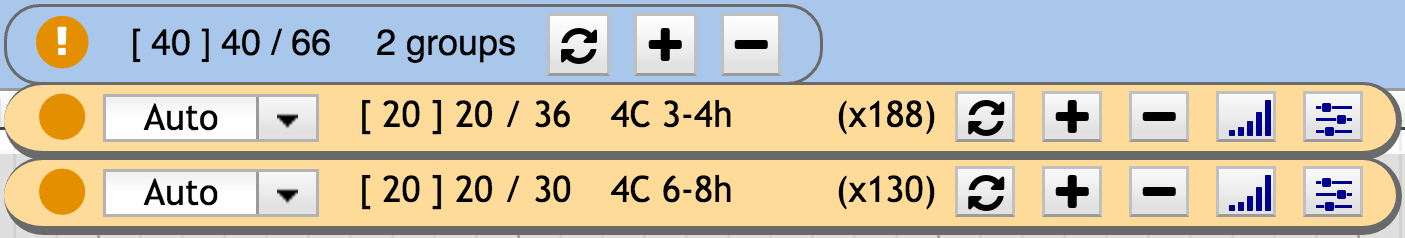
Alternatively, the user can limit the global number of tracks that dynamix adds in the track container. To control this, there is a “global_max_tracks” parameter which defines the maximum number of track that Dynamix can add on a given genomic interval. When this number is reached, the main widget number of track shown switches to red.