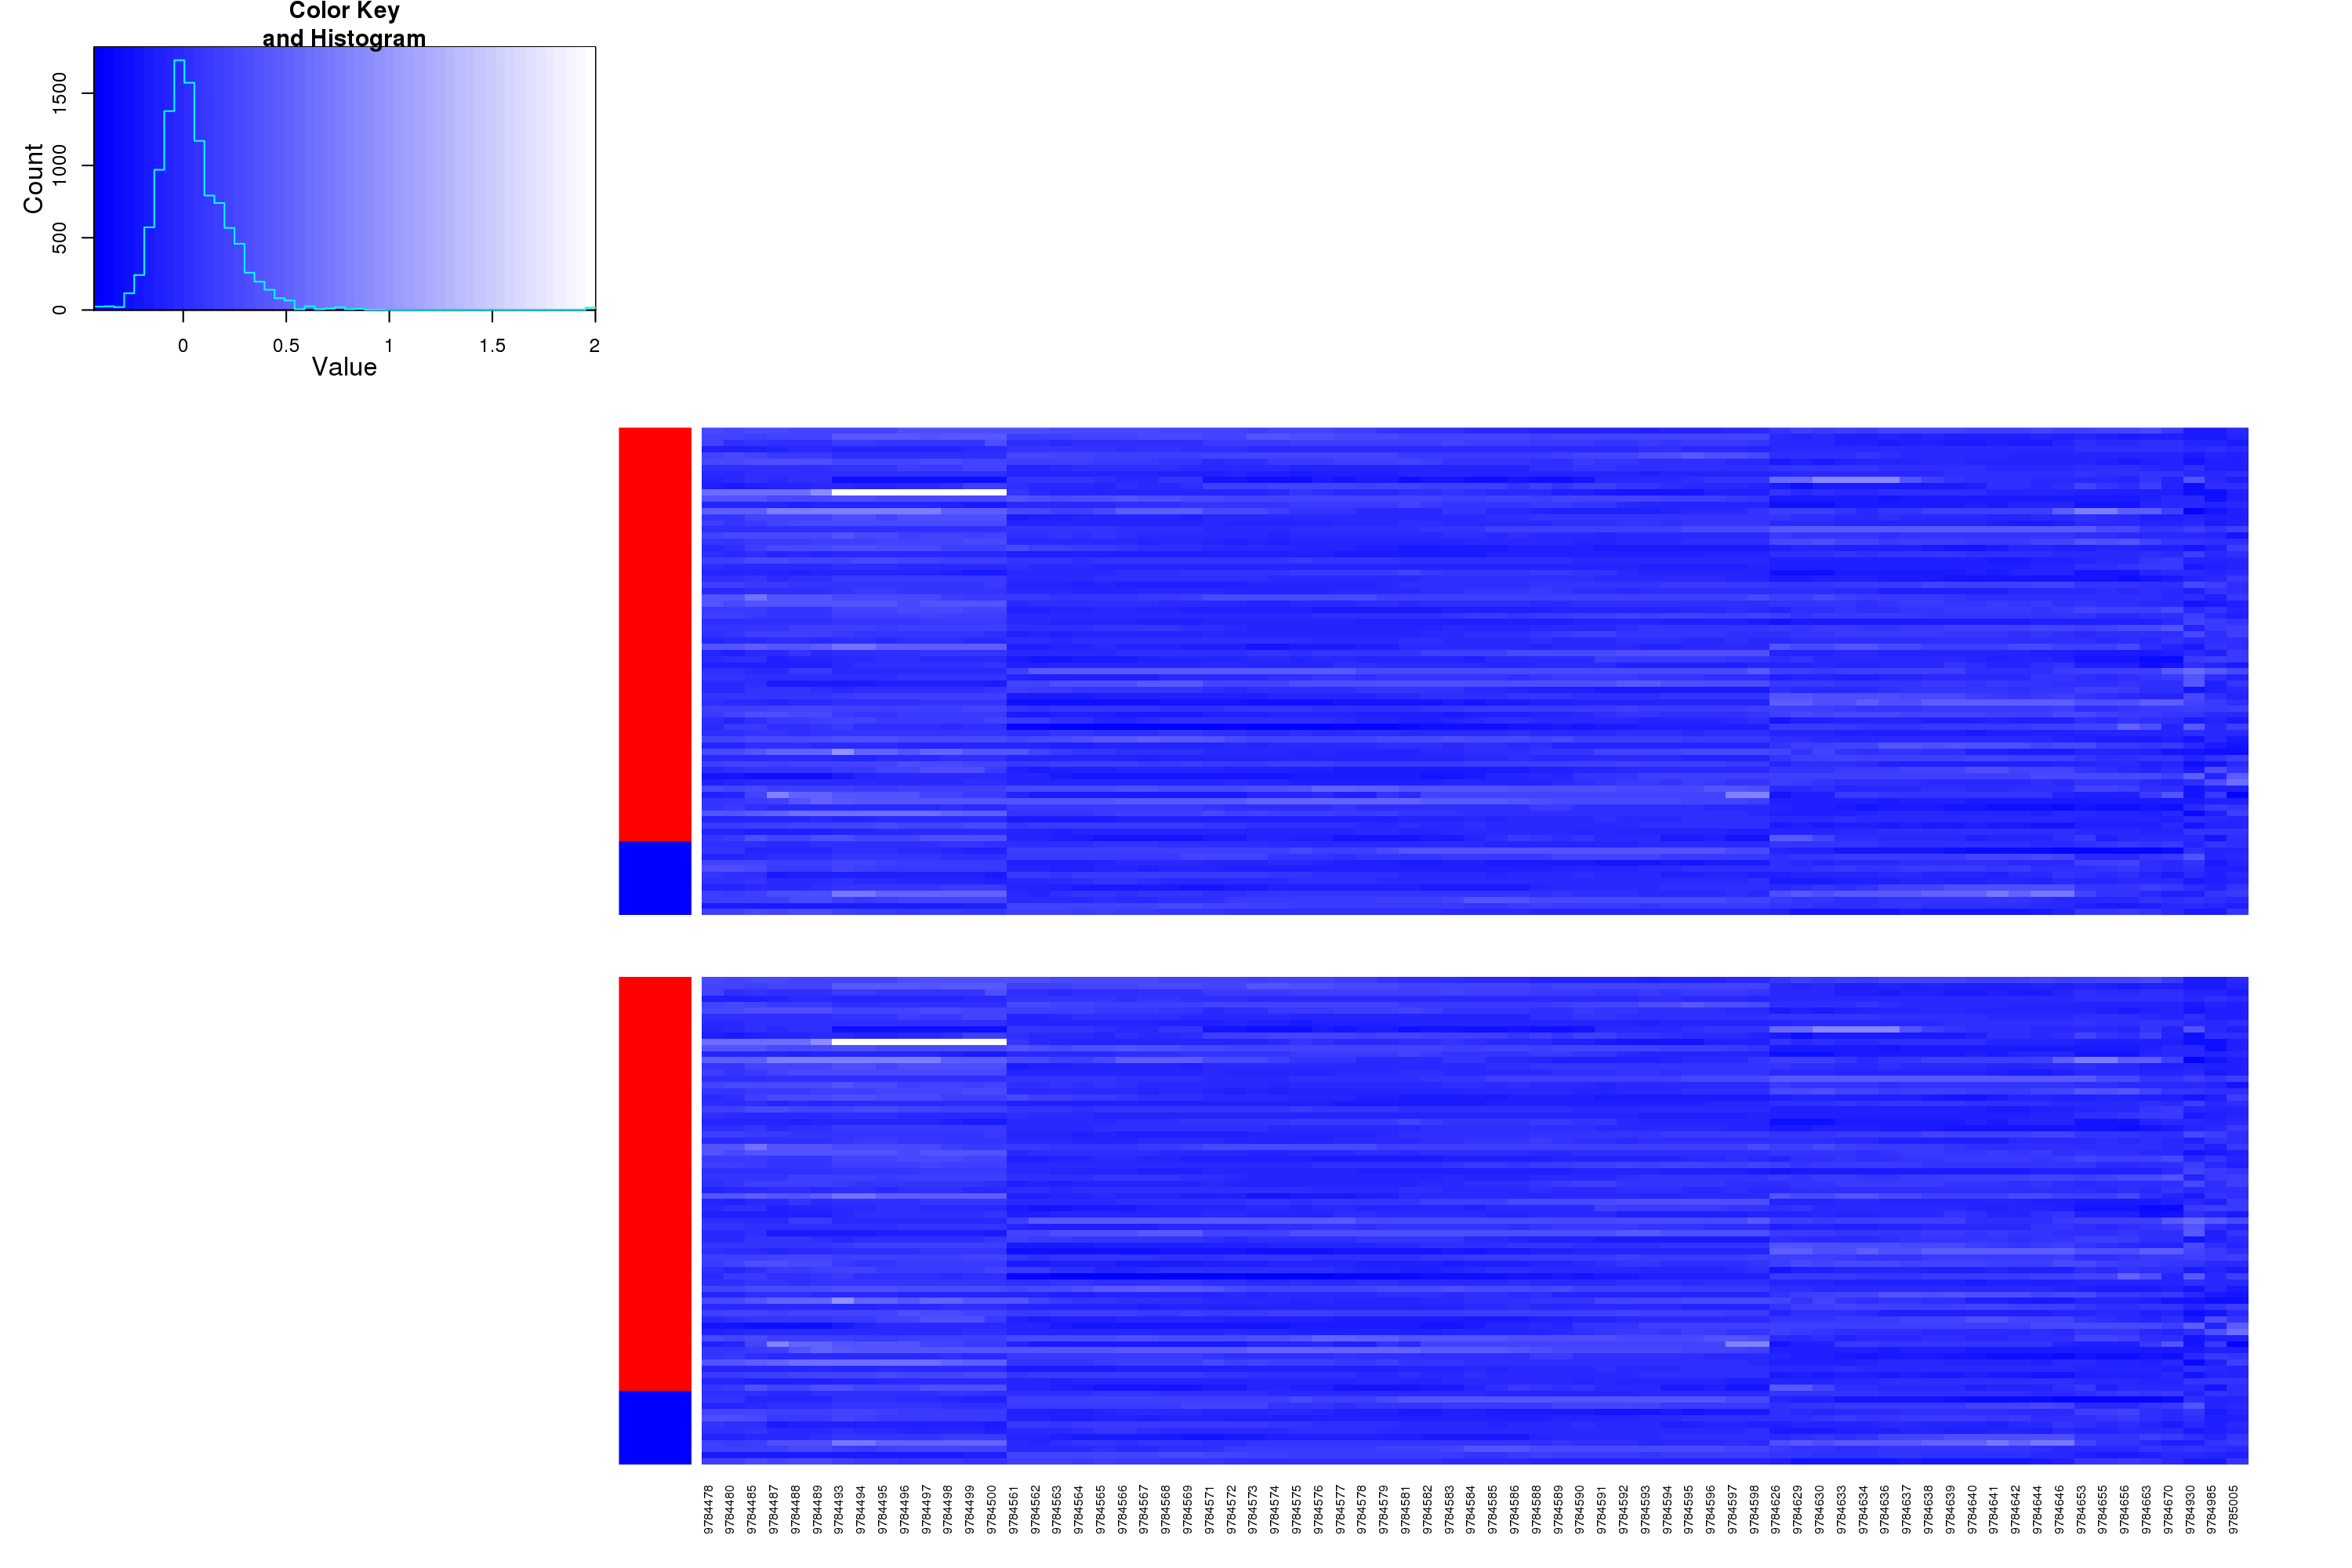
DNA unzoomed heatmap. This is identical to the unzoomed CAGE image plot however intensity represents the intensity of signal using raw DNA-sequencing as a phenotype. These plots are meant to highlight potential errors not caught in our mapability filters."
"From left to right: chr3R_9784060_9785083_DNA_geneheatmap_byMinCommonP_zoom